March 23, 2010
Category:
Kent Holsinger sends along this statistics discussion from a climate scientist. I don't really feel like going into the details on this one, except to note that this appears to be a discussion between two physicists about statistics. The blog in question appears to be pretty influential, with about 70 comments on most of its entries. When it comes to blogging, I suppose it's good to have strong opinions even (especially?) when you don't know what you're talking about.
P.S. Just to look at this from the other direction: I know next to nothing about climate science, but at least I recognize my ignorance! This is perhaps related to Kaiser's point that statisticians have to be comfortable with uncertainty. In contrast, I could well believe that someone who goes into physics would find complete certainty to be appealing. The laws of physics are pretty authoritative, after all.
Posted by Andrew Gelman at 3:59 PM • 2 Comments • 0 TrackBacks
March 22, 2010
Category:
I came across this news article by Sharon Begley: Mind Reading Is Now Possible: A computer can tell with 78 percent accuracy when someone is thinking about a hammer and not pliers.
The article came out in 2008. I'm just wondering what's been happening since in this area.
Posted by Andrew Gelman at 8:29 AM • 3 Comments • 0 TrackBacks
March 21, 2010
Category:
Felix Salmon gives the story. I haven't read the research articles, but it's an interesting story. As Salmon frames the book, it's Freakonomics-the-book vs. Freakonomics-style empirical analysis.
P.S. I'm assuming that both numbers above have been rounded to the nearest billion.
Posted by Andrew Gelman at 12:18 PM • 0 Comments • 0 TrackBacks
March 17, 2010
Category:
Here.
Posted by Andrew Gelman at 12:55 PM • 1 Comments • 0 TrackBacks
March 16, 2010
Category:
Jeremy Miles pointed me to this article by Leonhard Held with what might seem like an appealing brew of classical, Bayesian, and graphical statistics:
P values are the most commonly used tool to measure evidence against a hypothesis. Several attempts have been made to transform P values to minimum Bayes factors and minimum posterior probabilities of the hypothesis under consideration. . . . I [Held] propose a graphical approach which easily translates any prior probability and P value to minimum posterior probabilities. The approach allows to visually inspect the dependence of the minimum posterior probability on the prior probability of the null hypothesis. . . . propose a graphical approach which easily translates any prior probability and P value to minimum posterior probabilities. The approach allows to visually inspect the dependence of the minimum posterior probability on the prior probability of the null hypothesis.
I think the author means well, and I believe that this tool might well be useful in his statistical practice (following the doctrine that it's just about always a good idea to formalize what you're already doing).
That said, I really don't like this sort of thing. My problem with this approach, as indicated by my title above, is that it's trying to make p-values do something they're not good at. What a p-value is good at is summarizing the evidence regarding a particular misfit of model do data.
Rather than go on and on about the general point, I'll focus on the example (which starts on page 6 of the paper). Here's the punchline:
At the end of the trial a clinically important and statistically significant difference in
survival was found (9% improvement in 2 year survival, 95% CI: 3-15%.
Game, set, and match. If you want, feel free to combine this with prior information and get a posterior distribution. But please, please, parameterize this in terms of the treatment effect: put a prior on it, do what you want. Adding prior information can change your confidence interval, possibly shrink it toward zero--that's fine. And if you want to do a decision analysis, you'll want to summarize your inference not merely by an interval estimate but by a full probability distribution--that's cool too. You might even be able to use hierarchical Bayes methods to embed this study into a larger analysis including other experimental data. Go for it.
But to summarize the current experiment, I'd say the classical confidence interval (or its Bayesian equivalent, the posterior interval based on a weakly informative prior) wins hands down. And, yes, the classical p-value is fine too. It is what it is, and its low value correctly conveys that a difference as large as observed in the data is highly unlikely to have occurred by chance.
Posted by Andrew Gelman at 3:00 PM • 0 Comments • 0 TrackBacks
March 12, 2010
Category:
Sanjay Srivastava writes:
Below are the names of some psychological disorders. For each one, choose one of the following:
A. This is under formal consideration to be included as a new disorder in the DSM-5.
B. Somebody out there has suggested that this should be a disorder, but it is not part of the current proposal.
C. I [Srivastava] made it up.
Answers will be posted in the comments section.
1. Factitious dietary disorder - producing, feigning, or exaggerating dietary restrictions to gain attention or manipulate others
2. Skin picking disorder - recurrent skin picking resulting in skin lesions
3. Olfactory reference syndrome - preoccupation with the belief that one emits a foul or offensive body odor, which is not perceived by others
4. Solastalgia - psychological or existential stress caused by environmental changes like global warming
5. Hypereudaimonia - recurrent happiness and success that interferes with interpersonal functioning
6. Premenstrual dysphoric disorder - disabling irritability before and during menstruation
7. Internet addiction disorder - compulsive overuse of computers that interferes with daily life
8. Sudden wealth syndrome - anxiety or panic following the sudden acquisition of large amounts of wealth
9. Kleine Levin syndrome - recurrent episodes of sleeping 11+ hours a day accompanied by feelings of unreality or confusion
10. Quotation syndrome - following brain injury, speech becomes limited to the recitation of quotes from movies, books, TV, etc.
11. Infracaninophilia - compulsively supporting individuals or teams perceived as likely to lose competitions
12. Acquired situational narcissism - narcissism that results from being a celebrity
In academic research, "sudden wealth syndrome" describes the feeling right after you've received a big grant, and you suddenly realize you have a lot of work to do. As a blogger, I can also relate to #7 above.
. . . and statisticians
It's easy to make fun of psychiatrists for this sort of thing--but if statisticians had a similar official manual (not a ridiculous scenario, given that the S in DSM stands for Statistical), it would be equally ridiculous, I'm sure.
Sometimes this comes up when I hear about what is covered in graduate education in statistics and biostatistics--a view of data analysis in which each different data structure gets its own obscurely named "test" (Wilcoxon, McNemar, etc.). The implication, I fear, is that the practicing statistician is like a psychiatrist, listening to the client, diagnosing his or her problems, and then prescribing the appropriate pill (or, perhaps, endless Gibbs sampling^H^H^H^H^H^H^H^H^H^H^H^H^H^H^H talk therapy). I don't know if I have a better model for the training of thousands of statisticians, nor maybe do I have a full understanding of what statistical practice is like for people on the inferential assembly line, as it were. But I strongly feel that the testing approach--and, more generally, the approach of picking your method based on the data structure--is bad statistics. So I'm pretty sure I'd find much to mock in any DSM-of-statistics that might be created.
Another uncomfortable analogy between the two professions is that statistical tests, like psychiatric diagnoses, are trendy, despite their supposed firm foundation in mathematics and demonstrated practical success (just as psychiatry boasts a firm foundation medicine along with millions of satisfied customers over the decades). Compounding the discomfort is that some of the oldest and most established statistical tests are often useless or even counterproductive. (Consider the chi-squared test, which when used well can be helpful--see chapter 2 of ARM for an example--but is also notorious as being nothing more than "a test of sample size" and has let many researchers to disastrously oversimplify their data structures in order to fit the crudest version of this analysis.)
Instead of a DSM, the statistical profession has various standard textbooks, from Snedecor and Cochran to . . . whatever. But our informal DSM, as defined by practice, word-of-mouth, and our graduate curricula, is nothing to be proud of.
Posted by Andrew Gelman at 3:28 PM • 3 Comments • 0 TrackBacks
March 8, 2010
Category:
Brendan Nyhan links to this hilariously bad graph from the Wall Street Journal:
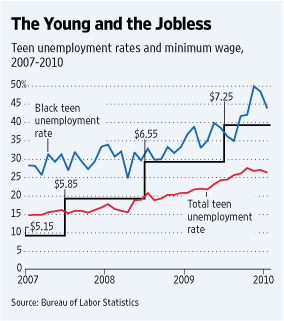
It's cute how they scale the black line to go right between the red and blue lines, huh? I'm not quite sure how $7.25 can be 39% of something, while $5.15 is 10%, but I'm sure there's a perfectly good explanation . . .
Follow the above link for more details. As Brendan notes, the graph says essentially nothing about the relation between minimum wage laws and unemployment ("Any variable that trended in one direction during the current economic downturn will be correlated with the unemployment rate among teens or any other group.") and he also helpfully graphs the unemployment trends among the general population, which has a similar upward trend.
This is not to say that increases in the minimum wage are necessarily a good idea--that's not my area of expertise. I'm talkin here about a horrible graph--all the worse, I fear, because of its professionalism. The above graph looks legit--it has many of the visual signifiers of seriousness, looking similar to a newsy graph you might see in the Economist, rather than like a joke graph of the sort identified with USA Today and parodied so well by the Onion.
P.S. I have no problem with the use of a crisp graph to make a political point; see for example here or here.
Posted by Andrew Gelman at 7:41 AM • 6 Comments • 0 TrackBacks
March 7, 2010
Category:
Brendan Nyhan passes along an article by Don Green, Shang Ha, and John Bullock, entitled "Enough Already about 'Black Box' Experiments: Studying Mediation Is More Difficult than Most Scholars Suppose," which begins:
The question of how causal effects are transmitted is fascinating and inevitably arises whenever experiments are presented. Social scientists cannot be faulted for taking a lively interest in "mediation," the process by which causal influences are transmitted. However, social scientists frequently underestimate the difficulty of establishing causal pathways in a rigorous empirical manner. We argue that the statistical methods currently used to study mediation are flawed and that even sophisticated experimental designs cannot speak to questions of mediation without the aid of strong assumptions. The study of mediation is more demanding than most social scientists suppose and requires not one experimental study but rather an extensive program of experimental research.
That last sentence echoes a point that I like to make, which is that you generally need to do a new analysis for each causal question you're studying. I'm highly skeptical of the standard poli sci or econ approach which is to have the single master regression from which you can read off many different coefficients, each with its own causal interpretation.
The article seems reasonable to me (I'm basing my judgments on the downloadable version here), although I can't figure out why an article with three authors is written in the first person. Also, I'd slam them for writing a paper with no graphs--except that I just did the same thing, on the same topic!
Green et al. set things up by explaining why causal path analysis seems like a good idea:
One can scarcely fault scholars from expressing curiosity about the mechanisms
by which an experimental treatment transmits its influence. After all, many of the most
interesting discoveries in science have to do with the identifying mediating factors in a
causal chain. For example, the introduction of limes into the diet of seafarers in the 18th
century dramatically reduced the incidence of scurvy, and eventually 20th century
scientists figured out that the key mediating ingredient was vitamin C. Equipped with
knowledge about why an experimental treatment works, scientists may devise other,
possibly more efficient ways of achieving the same effect. Modern seafarers can prevent
scurvy with limes or simply with vitamin C tablets.
Arresting examples of mediators abound in the physical and life sciences. Indeed, not only do scientists know that vitamin C mediates the causal relationship between limes and scurvy, they also understand the biochemical process by which vitamin C counteracts the onset of scurvy. In other words, mediators themselves have mediators. Physical and life scientists continually seek to pinpoint ever more specific explanatory agents.
But now the bad news:
Given the strong requirements in terms of model specification and measurement, the enterprise of "opening the black box" or "exploring causal pathways" using endogenous mediators is largely a rhetorical exercise. I [Green, Ha, and Bullock] am at a loss to produce even a single example in political science in which this kind of mediation analysis has convincingly demonstrated how a causal effect is transmitted from X to Y.
And then they put it all in perspective:
My [Green, Ha, and Bullock's] argument is not that the search for mediators is pointless or impossible. Establishing the mediating pathways by which an effect is transmitted can be of enormous theoretical and practical value, as the vitamin C example illustrates. Rather, I take issue with the impatience that social scientists often express with experimental studies that fail to explain why an effect obtains. As one begins to appreciate the complexity of mediation analysis, it becomes apparent why the experimental investigation of mediators is slow work. Just as it took almost two centuries to discover why limes cure scurvy, it may take decades to figure out the mechanisms that account for the causal relationships observed in social science.
OK, what's everybody talkin bout?
Here's the method that Green et al. criticize:
Although path analysis goes back several decades, mediation analyses surged in popularity in the 1980s with the publication of Baron and Kenny (1986) . . . First, one regresses the outcome (Y) on the independent variable (X). Upon finding an effect to be explained, one proposes a possible mediating variable (M) and regresses it on X. If X appears to cause M, the final step is to examine whether the effect of X becomes negligible when Y is regressed on both M and X. If M predicts Y and X does not, the implication is that X transmits its influence through M.
This approach has always seemed pretty hopeless to me, but a colleague whom I respect has defended it to me, a bit, by framing it as an adjunct to experimental research. As he puts it, the serious social psychologists would not dream of applying the mediatoin analysis stuff directly to observational data. Rather, it's their attempt to squeeze more out of experimental data. From that perspective, maybe it's not so horrible.
Beyond nihilism
Green et al. don't just sit around and criticize; they also offer suggestions for moving forward:
A more judicious approach at this juncture in the development of social science would be to encourage researchers to measure as many outcomes as possible when conducting experiments. For example, consider the many studies that have sought to increase voter turnout by means of some form of campaign contact, such as door-to-door canvassing. In addition to assessing whether the intervention increases turnout, one might also conduct a survey of random samples of the treatment and control groups in order to ascertain whether these groups differ in terms of interest in politics, feelings of civic responsibility, knowledge about where and how to vote, and so forth. With many mediators and only one intervention, this kind of experiment cannot identify which of the many causal pathways transmit the effect of the treatment, but if certain pathways are unaffected by the treatment, one may begin to argue they do not explain why mobilization works. As noted above, this kind of analysis makes some important assumptions about homogenous treatment effects, but the point is that this type of exploratory investigation may provide some useful clues to guide further experimental investigation.
As researchers gradually develop intuitions about the conditions under which effects are larger or smaller, they may begin to experiment with variations in the treatment in an effort to isolate the aspects of the intervention that produce the effect. For example, after a series of pilot studies that suggested that social surveillance might be effective in increasing voter turnout, Gerber, Green, and Larimer (2008) launched a study in which subjects were presented one of several interventions. One encouraged voting as a matter of civic duty; another indicated that researchers would be monitoring who voted; a third revealed the voting behavior of all the people living at the same address; and a final treatment revealed the voting behavior of those living on the block. This study stopped short of measuring mediators such as one's commitment to norms of civic participation or one's desire to maintain a reputation and an engaged citizen; nevertheless, the treatments were designed to activate mediators to varying degrees. One can easily imagine variations in this experimental design that would enable the researcher to differentiate more finely between mediators. And one can imagine introducing survey measures to check whether these inducements produce an intervening psychological effect consistent with the posited mediator.
You won't be surprised to hear that I like the focus on active research examples.
Posted by Andrew Gelman at 11:59 AM • 2 Comments • 0 TrackBacks
March 4, 2010
Category:
This looks interesting:
Jean-Luc Thiffeault
Mathematics Department, University of Wisconsin - Madison
"Do fish stir the ocean?"
As fish or other bodies move through a fluid, they stir their surroundings. This can be beneficial to some fish, since the plankton they eat depends on a well-stirred medium to feed on nutrients. Bacterial colonies also stir their environment, and this is even more crucial for them since at small scales there is no turbulence to help mixing. It has even been suggested that the total biomass in the ocean makes a significant contribution to large-scale vertical transport, but this is still a contentious issue. We propose a simple model of the stirring action of moving bodies through both inviscid and viscous fluids. In the dilute limit, this model can be solved using Einstein and Taylor's formula for diffusion (Brownian motion).
This is joint work with Steve Childress.
APPLIED MATHEMATICS COLLOQUIUM
Tuesday, March 9, 2010
2:45-3:45 PM
Room 214 Mudd
Columbia University, New York
Posted by Andrew Gelman at 2:55 PM • 2 Comments • 0 TrackBacks